Next: Manufacturing Oligonucleotide Arrays
Up: DNA Chips/Microarrays
Previous: Oligonucleotide Arrays
These are very similar to the oligonucleotide arrays. Instead of short
oligos on the DNA chip, each spot contains a cDNA clone from
a known gene. Since cDNA clones are much longer than oligos (can be
thousands of nucleotides long), a successful hybridization with a clone
is an almost certain match for the gene. This allows us to quickly
recognize expression levels of known genes.
Because the amount of hybridization is highly dependent on the length
of the sequences, and because it is much more difficult to ensure
an exact number of clones in each spot than it is in the oligonucleotide
chips, simply checking the hybridization level for each spot will not
suffice. Instead, when using cDNA microarrays we compare the
hybridization level in each spot to the level of hybridization under
``control conditions''. The relative level is independent of the length
distribution of the clones, so our results contain more pertinent
information. The actual measurement is done by ``tagging'' the mRNA
harvested from control cells with one color dye (say green), and the
target cells with another color (say red). The cDNA microarray is
exposed to a solution containing a mixture of the control and target
cells. We then ``read'' the hybridization level with an appropriately
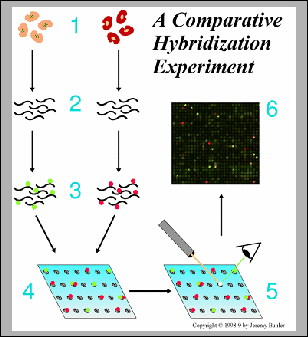
colored laser. Figure 11.2 illustrates this process.
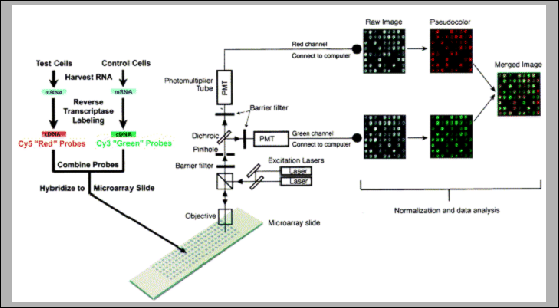
Figure 11.3 shows the reading mechanism in greater detail.
Figure 11.2:
A comparative hybridization
experiment with cDNA microarrays: 1. Control Cells (left) and
Target Cells (right); 2. Harvesting mRNA from both cell groups;
3. Tagging the mRNA with green and red dye;
4. Applying the mRNA to the cDNA microarray;
5. Reading the result using a laser;
6. A false-color composite representing the results.
|
|
Figure 11.3:
cDNA microarray reading apparatus.
The test/control mRNA molecules are excited by laser beams
of two different frequencies. The two resulting images
of all the spots are used for analysis.
|
|
Next: Manufacturing Oligonucleotide Arrays
Up: DNA Chips/Microarrays
Previous: Oligonucleotide Arrays
Peer Itsik
2001-01-31