Next: Gene Structure in Eukaryotes
Up: Gene Finding
Previous: Compositional Differences
Detecting Promoter Regions
Promoter regions in DNA sequences do not follow a strict pattern. This makes the
identification of promoter regions more difficult. Although
promoter regions vary, it is usually possible to find a DNA
sequence (called the consensus sequence) to which all the of
them are very similar. For example, the consensus in the bacterium
E.coli, based on the study of 263 promoters, is TTGACA
followed by 17 uncorrelated base pairs, followed by TATAAT, with
the latter, called TATA box, located about 10 bases upstream
of the transcription start site. None of the 263 promoter regions
exactly match the above consensus sequence. Nevertheless, the
consensus sequence is representative: nearly all of E.coli's
promoters terminate with 2 of the 3 specified letters of the
sequence TAxyzT, 80-90% have all 3, and xyz is TAA in
approximately 50% of the promoter regions.
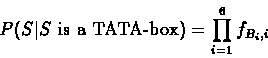
Due to the high variability, exact methods cannot be used for
identifying promoter regions by the TATA box. Instead, we use a
pattern search method based on frequencies. We construct a table
of statistics, fb,i, where fb,i is the frequency of the
base b in position i of the known promoter region suffixes. We
assume positions are independent.
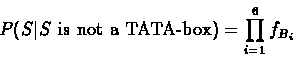
Let fb denote the expected frequency of the base b in the
genome. We calculate the likelihood of a given sequence being a
TATA-box. For a sequence
 the likelihood of it
being a TATA-box is:
the likelihood of it
being a TATA-box is:
Similarly, the likelihood
of observing it, given it is a "non-promoter" is:
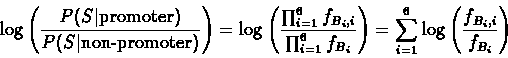
The log-likelihood
ratio is therefore:
From
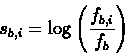
the table fBi,i we therefore construct a scoring
matrix, with each entry Sb,i denoting the score that a
sequence should be given for having the base b in the i-th
position. The score sb,i is computed by the following
formula:
The algorithm simply scans through the DNA sequence and
computes the likelihood ratio for every consecutive 6 bases and
thus locates regions where the likelihood ratio is high. This
model has the disadvantage that it doesn't exploit all of the
known information (i.e. intron/exon statistic, dependencies
between bases occurring in the promoter regions etc.)
Why aren't promoters precise like the stop codons etc.? A likely
answer is that nature uses the variation in promoters to control
expression levels of various genes. That is, the rate of the gene
expression process depends on the conservation of the promoter
region. This hypothesis is supported by results from chemistry.
Experiments show that when a RNA polymerase molecule gets bounded
to the prompter region in order to initial transcription, there is
an 80% correlation between the weight matrix score of the region
and the binding energy. This means that if the promoter region is
very conserved, i.e., very similar to the consensus sequence, then
the binding energy barrier is low and thus the protein production
rate is higher (because the RNA polymerase can easily bind to the
protein coding region). When the difference from the consensus
sequence is bigger, the energy barrier is higher, and the protein
production is slower. The unfortunate consequence is that rarely
expressed genes will be harder to find by this means.
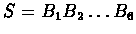
Figure 7.8:
Promoter detection by matrix evaluations of the
sequence for containing a TATA-box. The matrix contains an element
for each possible matrix position. For each alignment of the
matrix above the sequence, a score is computed based on the matrix
elements corresponding to the sequence. The matrix rows correspond
to the bases A,C,G,T from top to bottom. The sequence TATAAT
scores highest.
|
Next: Gene Structure in Eukaryotes
Up: Gene Finding
Previous: Compositional Differences
Itshack Pe`er
1999-02-03