prima1 - System Load percentage (incl. user, system, wait and nice)
The statistics were last updated Thursday, 15 March 2012 at 12:10
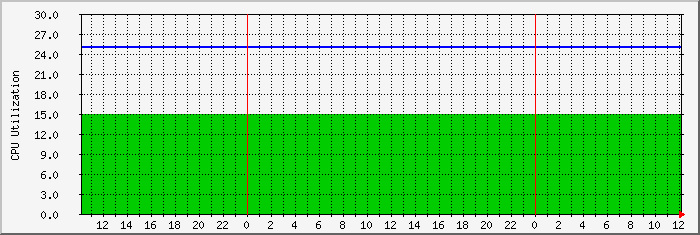
`Daily' Graph (5 Minute Average)

|
Max |
Average |
Current |
| usage (%) |
15.0 % |
15.0 % |
15.0 % |
| Out |
25.0 % |
25.0 % |
25.0 % |
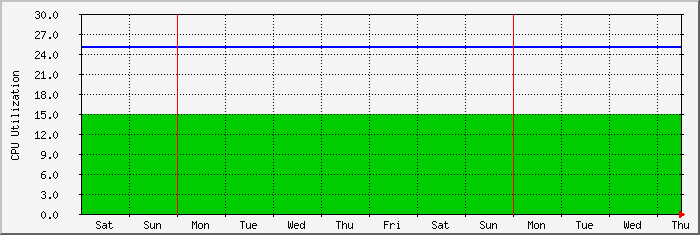
`Weekly' Graph (30 Minute Average)

|
Max |
Average |
Current |
| usage (%) |
15.0 % |
15.0 % |
15.0 % |
| Out |
25.0 % |
25.0 % |
25.0 % |
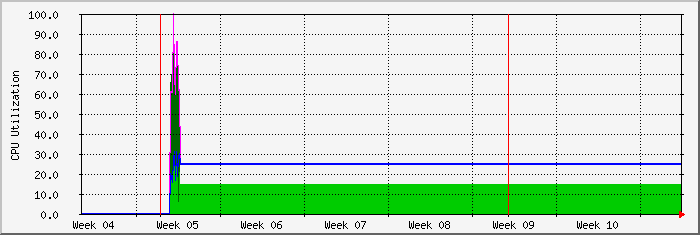
`Monthly' Graph (2 Hour Average)

|
Max |
Average |
Current |
| usage (%) |
100.0 % |
15.0 % |
15.0 % |
| Out |
100.0 % |
25.0 % |
25.0 % |
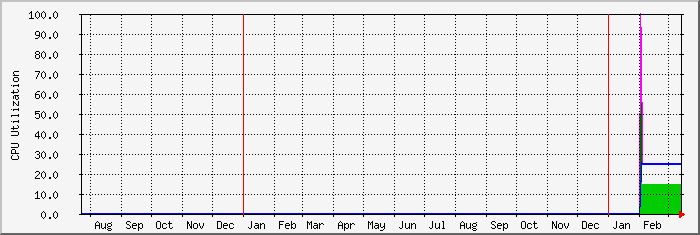
`Yearly' Graph (1 Day Average)

|
Max |
Average |
Current |
| usage (%) |
100.0 % |
15.0 % |
15.0 % |
| Out |
100.0 % |
25.0 % |
25.0 % |
| GREEN ### |
CPU usage in % (Load) |
| BLUE ### |
Outgoing Traffic in Bytes per Second |
| DARK GREEN ### |
Maximal 5 Minute Incoming Traffic |
| MAGENTA ### |
Maximal 5 Minute Outgoing Traffic |
